Rethinking the Product Lifecycle with a Data Assistant
2025-07-15
Background
In modern product development, data plays a pivotal role across the entire lifecycle. From defining what success looks like, to tracking user behavior, to validating the actual impact of a feature, data sits at the core of every decision.
Yet most teams still suffer from fragmented workflows:
Product managers define vague goals, engineers scramble to wire telemetry, analysts patch together datasets, and everyone spends more time verifying logs than uncovering insights. It's a cycle of inefficiency, silos, and rework.
What if we could embed an intelligent Data Assistant throughout the entire product lifecycle—one that understands the product, speaks the language of both PM and engineer, and operates with the memory and precision of a seasoned analyst?
Goal
The data assistant should be a collaborative system between humans and intelligent agents that elevates the overall efficiency and quality of product decision-making and data capabilities:
- PMs focus on goals and context
- Agents provide suggestions, translate needs, and generate actionable plans
- Engineers quickly implement code integrations
- Analysts skip repetitive ETL work and focus on reasoning and validation
- Leadership receives trustworthy, high-level insights instantly
A great Data Assistant isn’t just a tool—it’s a teammate.
Fast, professional, with memory, adaptable to your context, always ready to help you make smarter decisions.
🧠 A well-designed Data Assistant could do at each key stage:
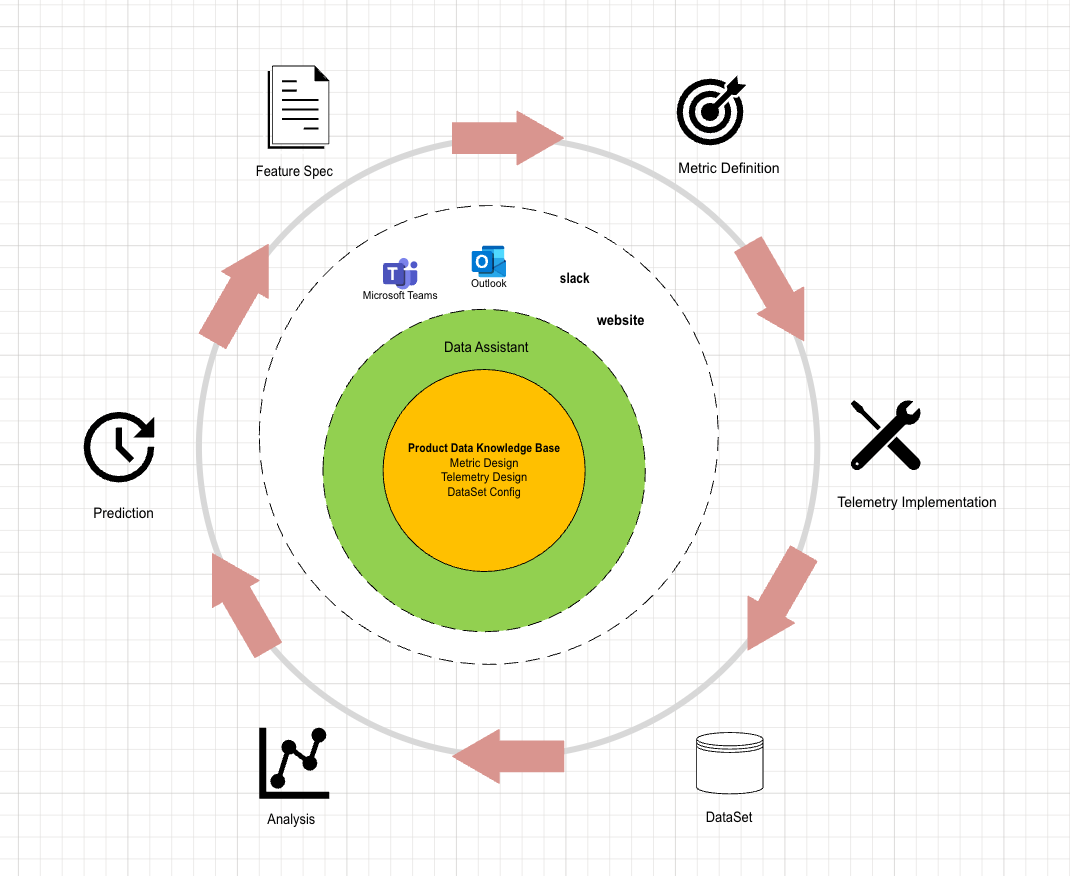
Illustration of Data Assistant’s role across product lifecycle stages.
1. Spec → Data Design (Metric, Telemetry)
Goal: Translate product goals into measurable KPIs.
Interaction:
“Generate a data design doc from this feature spec and UX mockup.”
Output:
- A structured data design document detailing:
- Key metrics to be tracked
- Required telemetry events, parameters, and triggers
- Auto-extracted metric and telemetry definitions stored in the centralized knowledge base
Impact & Usage:
- Creates a shared understanding across PM, engineering, and data teams
- Reusable definitions for telemetry implementation, dataset building, dashboarding, and analysis
- Speeds up alignment and improves traceability throughout the product lifecycle
2. Data Design Document → Implementation
Goal: Turn Document into a tracking code.
Interaction:
“Generate client-side tracking code based on the telemetry schema.”
Output:
- Auto-generated telemetry code for client platforms (e.g. Web, Android, iOS)
Impact & Usage:
- Reduces manual translation from design to code
- Improves coverage and consistency across platforms
- Allows engineers to focus on business logic instead of boilerplate code
3. Telemetry → Validation
Goal: Ensure that logs are accurate and complete.
Interaction:
“Help me verify the telemetry for this feature.”
Output:
- Auto-generated Kusto/SQL queries for log inspection
- Validation tools: schema checks, log playback
Impact & Usage:
- Detects telemetry issues early, reducing costly downstream rework
- Increases confidence in data reliability for PM, QA, and analysts
4. Raw Data → Structured Datasets
Goal: Automate ETL based on metadata-driven logic.
Value:
- Define once, reuse many times: metric/event metadata drives dataset generation
- Output structured datasets at different granularities (event-level, user-level, metric-level)
Impact & Usage:
- Cuts down manual ETL effort
- Ensures consistency across teams and time
- Supports scalable, versioned dataset pipelines
5. Metric → Dashboard & Reports
Goal: Turn metrics into visual stories.
Interaction:
“How many users clicked the sign-in button this week?”
Output:
- Instant metric visualizations
- Auto-generated dashboards
- Recurring reports with embedded insights
Impact & Usage:
- Empowers self-serve insights for PMs, analysts, and leadership
- Shortens time-to-visibility for key product behaviors
- Standardizes report generation with reusable templates
6. Advanced Analysis & Forecasting
Goal: Go beyond BI into A/B testing, impact analysis, and forecasting.
Capabilities:
- Auto-generated notebooks with clean code, charts, and commentary
- What-if simulation (e.g., “What if this feature was removed?”)
- Summary generation with impact scores, risk estimates, and confidence levels
Impact & Usage:
- Enables faster, deeper decision-making
- Lowers the barrier for advanced analytics
- Makes experimentation and forecasting accessible across teams
7. Feature Suggestion
Goal: Close the loop by turning insights into new product hypotheses.
Interaction:
“What should we build next based on recent user behavior?”
Capabilities:
- Auto-surfaced user pain points and usage gaps from metric patterns
- Opportunity detection based on funnel drop-offs, retention trends, and feedback signals
- Hypothesis generation with supporting data and confidence tags
Impact & Usage:
- Transforms passive observation into proactive iteration
- Gives PMs and teams a head start in roadmap planning
- Builds a continuous loop from data to decision to innovation
Future Outlook
As data-driven product development evolves, embedding intelligent agents that seamlessly integrate into workflows will redefine team collaboration and decision-making culture. The Data Assistant will not replace human expertise but amplify it—turning scattered efforts into cohesive, insightful action.